Picture this: you spend three hours building a comprehensive SEO report. It has keyword rankings, crawl error graphs, backlink counts, domain authority trends, and a detailed breakdown of impressions by device. You present it to the CEO. They look at it for thirty seconds and ask: “But are we making more money from this?”
That question is not a failure of the CEO. It is a failure of the dashboard.
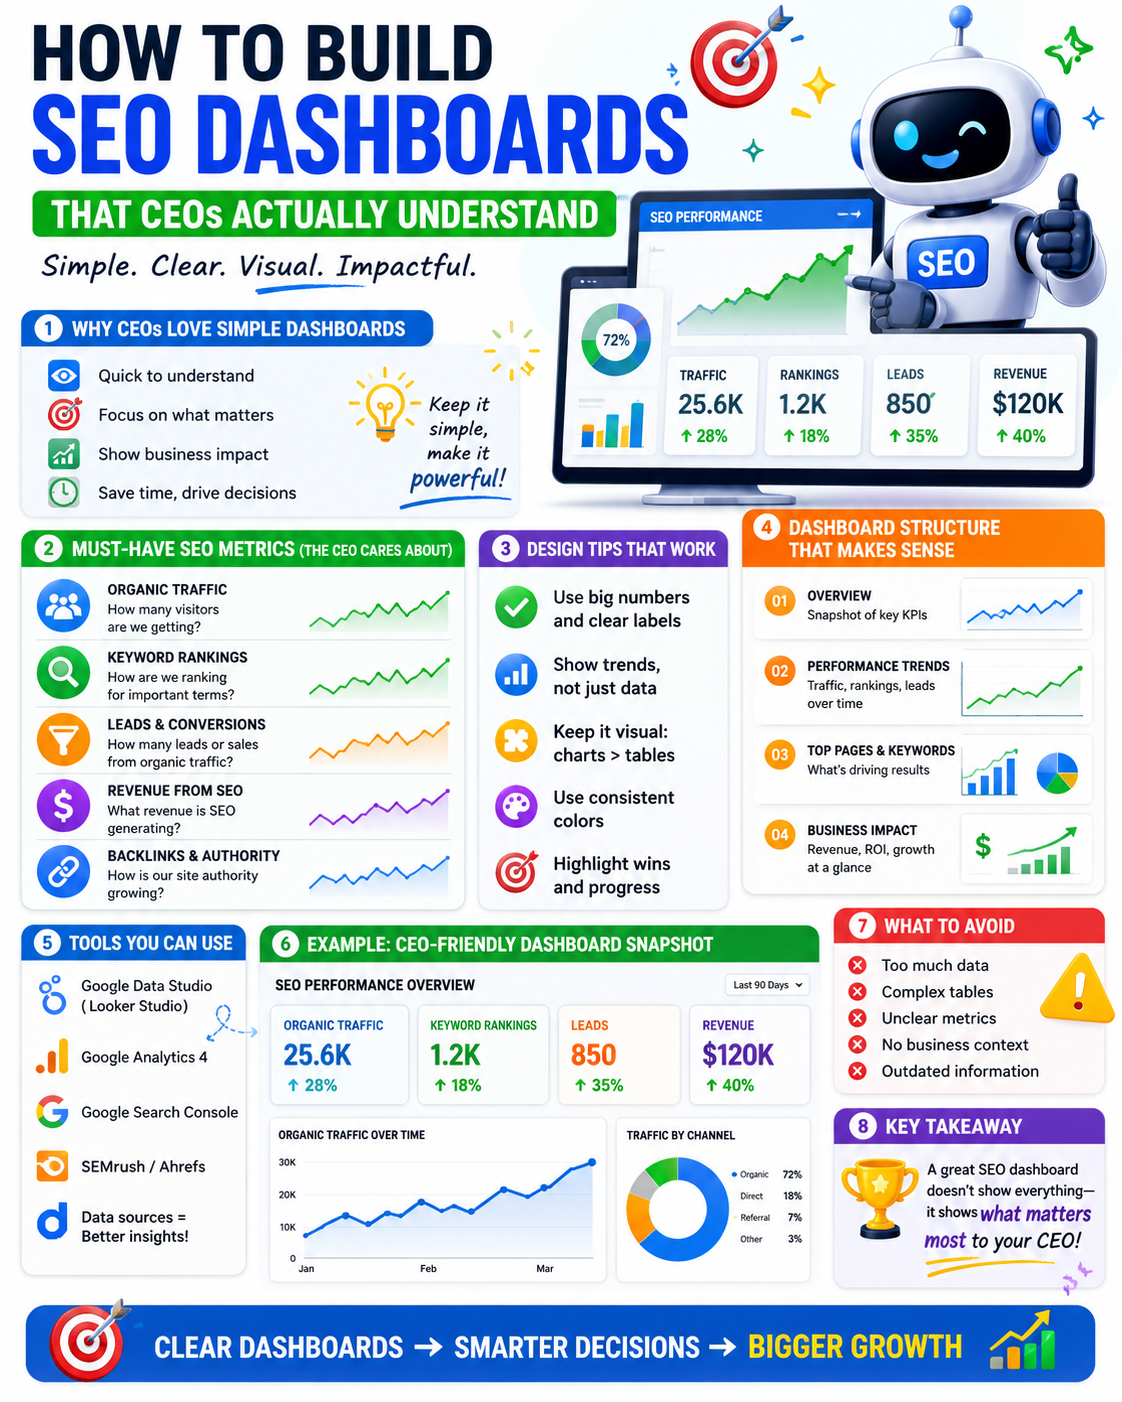
Most SEO dashboards are built for SEO professionals — people who understand what domain authority means, why crawl budget matters, and how to interpret a position tracking chart. CEOs are not SEO professionals. They are business operators who need to know one thing: is this investment working?
This guide shows you exactly how to build an SEO dashboard that answers that question — in the language of business, not the language of search engines.
Why Most SEO Dashboards Fail with Executives
The core problem is that SEO professionals tend to report on inputs and activities rather than outputs and outcomes.
Inputs are things like published content, acquired backlinks, and fixed technical errors. Outputs are things like organic revenue, leads generated, and customer acquisition cost from organic search. CEOs care almost exclusively about outputs. Most SEO dashboards are almost exclusively built around inputs.
Three mistakes drive this disconnect:
Too many metrics. When a dashboard shows twenty-five different data points, the viewer does not know where to look. Instead of focusing on what matters, they disengage entirely. A dashboard that shows everything communicates nothing.
Wrong metrics. Domain authority, bounce rate, and crawl errors are useful for an SEO team to monitor internally. They are meaningless to a CEO without significant context — and even then, they are not the metrics that drive budget decisions.
No narrative. A collection of charts is not a report. Without context, trend lines, and plain-language explanation, the CEO is left to interpret the data themselves. They will not do this. They will move on.
A dashboard is a communication tool. Its only job is to answer one question clearly: is SEO working for the business?
What Metrics Do CEOs Actually Care About?
This is where most SEO reporting goes wrong — not in the tool or the design, but in the metric selection. Here is a clear framework for what to include and what to cut.
Metrics to Include
Every metric on a CEO dashboard should connect directly to a business outcome. These are the ones that earn their place:
Organic revenue — actual revenue attributed to organic search, pulled from Google Analytics e-commerce tracking or your CRM. This is the single most important number on the dashboard. If you can show only one metric, show this one.
Organic leads and conversions — the number of form fills, demo requests, phone calls, or purchases generated by organic traffic. For non-e-commerce businesses, this replaces organic revenue as the primary outcome metric.
Organic traffic trend — month-over-month and year-over-year growth expressed as a percentage, not a raw session count. A CEO seeing “48,000 sessions” has no context. A CEO seeing “organic traffic up 22% year over year” understands immediately.
SEO contribution vs. other channels — what percentage of total revenue or conversions came from organic search compared to paid, social, direct, and referral. This is one of the most persuasive charts for budget conversations.
Cost per acquisition from organic — if you can calculate this, include it. Organic CPA compared to paid CPA makes a compelling case for continued SEO investment in purely financial terms.
Keyword visibility for priority terms — ranking movement for five to ten of your most commercially important keywords. Not a list of two hundred keywords. The five to ten terms that drive the highest-value traffic.
Metrics to Remove
Be ruthless here. These metrics belong in your internal team report, not the CEO dashboard:
- Impressions and clicks without conversion context
- Crawl errors and technical issues — handle internally, escalate only when business-critical
- Domain authority or domain rating — a third-party tool metric that no CEO needs to track
- Raw backlink counts — unless directly tied to a specific campaign milestone
- Bounce rate without clear context and comparison — one of the most misunderstood metrics in digital marketing
The principle is simple: if a metric does not connect to revenue, growth, or competitive position, it does not belong in front of the CEO.
How to Structure a CEO-Ready SEO Dashboard
Layout matters as much as metric selection. Here is a section-by-section structure that works for executive audiences across industries.
Section 1 — The Business Summary
Place this at the very top of the dashboard. It should contain one to three headline numbers that answer “how is SEO performing for the business this month?” at a glance.
Use large, clear visuals — percentage change callouts, traffic light indicators, or simple comparison cards showing this period versus last period. The CEO should be able to understand this section in under ten seconds.
Suggested metrics for this section: organic revenue versus previous period, organic conversions versus previous period, and organic traffic trend as a percentage.
Section 2 — Revenue and Conversion Trend
A 12-month chart showing organic revenue and conversions over time, with month-over-month percentage changes annotated. If your business has multiple product lines or service areas, break this down to show which parts of the business are benefiting most from organic search.
This section answers: “is SEO performance improving, declining, or holding steady — and where specifically?”
Section 3 — Channel Comparison
A simple bar chart or pie chart showing organic search contribution versus paid search, social media, direct, and referral traffic — measured by revenue or conversions, not sessions.
This section is often the most powerful in budget conversations. When a CEO can see that organic search is responsible for 38% of all revenue at a fraction of the cost of paid, the case for continued SEO investment makes itself.
Section 4 — Keyword Visibility for Priority Terms
A simplified table or chart showing ranking movement for your five to ten most commercially important keywords over the last 90 days. Include current position, previous position, and the search volume for each term.
Do not include every keyword you track. Curate this section carefully. The CEO should recognize these terms as the core of the business, not wonder why you are tracking “best blue widget near me.”
Section 5 — Key Wins and Next Steps
Place this at the bottom of the dashboard. Two to three bullet points explaining what drove performance this period — in plain language, not SEO jargon. And two to three bullet points on what the team is prioritizing in the coming month and why.
This section transforms the dashboard from a historical record into a forward-looking management tool. It gives the CEO something to discuss, something to approve, and something to follow up on at the next review.
Choosing the Right Tool for Your CEO Dashboard
The tool matters less than the structure and metric selection — but choosing the right one saves significant time and produces cleaner outputs.
Google Looker Studio is the best starting point for most teams. It is free, connects directly to Google Analytics 4 and Search Console, produces clean professional visuals, and generates a shareable link that requires no login to view. The setup requires some time investment, but the output is a live dashboard the CEO can check at any time.
SEMrush and Ahrefs provide excellent out-of-the-box reporting for keyword rankings and organic visibility. They are less flexible for custom business metrics but work well for the keyword visibility section of the dashboard. Neither is suitable as a standalone CEO report without significant customization.
Databox and Klipfolio offer pre-built dashboard templates with multiple data source integrations. Faster to set up than Looker Studio and visually polished, but involve a monthly subscription cost that may not be justified for smaller teams.
Custom agency-built dashboards are the best option for clients who want a fully integrated, branded report without building it themselves. A good agency connects all data sources, applies your specific conversion goals, and delivers a dashboard that requires no interpretation from the client.
For most businesses, Google Looker Studio connected to Google Analytics 4 and Search Console is the right starting point. It is free, powerful, and produces shareable outputs that work for any audience.
How to Connect SEO Metrics to Business Outcomes
This is the hardest part of executive SEO reporting — and the part most teams skip or handle poorly.
Set up conversion tracking in Google Analytics 4. Every action that matters to the business — purchase, form submission, phone call, demo request, trial signup — must be tracked as a conversion event in GA4. If conversions are not tracked, you cannot show the business outcome of organic traffic, and the dashboard loses its most important metric.
Use UTM parameters consistently. Clean, consistent tagging across all channels ensures that organic traffic is correctly attributed in GA4 and not misclassified as direct. This is a foundational requirement for any accurate dashboard.
Connect CRM data where possible. For B2B businesses with longer sales cycles, website conversions are only part of the story. Connecting Salesforce or HubSpot data to your dashboard allows you to show pipeline value and closed revenue influenced by organic search — which is far more persuasive than showing form fills alone.
Use assisted conversion reporting. Organic search frequently plays a role earlier in the buyer journey — a user finds a blog post, leaves, returns via a branded search, and converts. Assisted conversion data shows SEO’s influence across the full journey, not just the last click.
Be honest about attribution limits. No attribution model captures the full picture. Say so clearly in the dashboard. Executives respect transparency about what the data does and does not show — far more than they respect overconfident claims that fall apart under scrutiny.
How Often Should You Update the CEO Dashboard?
Monthly is the right cadence for most businesses. Update all metrics at the start of each month for the previous month. Schedule a 20-minute review where the dashboard owner walks through key changes and the plan for the coming period.
Quarterly reviews go deeper — comparing performance against the annual SEO forecast, assessing whether the campaign is on track, and identifying whether any strategic adjustments are needed.
Annually, run a full retrospective comparing forecast versus actual, identifying what worked and what did not, and setting targets for the coming year.
The dashboard itself should be live at all times — not a PDF sent once a month. A shareable Looker Studio link means the CEO can check performance whenever they want, without requesting a report. This alone removes a significant source of friction in executive SEO relationships.
Common Mistakes to Avoid When Reporting SEO to Executives
- Reporting on activity instead of outcomes — publishing twelve blog posts is not an outcome; 340 leads from those posts is an outcome
- Using jargon without explanation — “E-E-A-T,” “canonical tags,” and “crawl budget” mean nothing to a CEO; if they must appear, explain each in one plain sentence immediately
- Showing raw numbers without trend or comparison — “42,000 organic sessions” is meaningless without a comparison point; “up 18% year over year” is immediately interpretable
- Burying the headline metric — the most important number belongs at the top of the dashboard, not on slide eleven of a PDF
- Hiding underperformance — if a metric missed its target, explain why and what is being done; CEOs respect honesty far more than polished spin
- Sending a static PDF — a PDF cannot be explored, filtered, or updated; always use a live dashboard link
- Updating numbers without a narrative — data without context requires the CEO to interpret results themselves, which they will not do and should not have to
Conclusion and Next Steps
A CEO dashboard is not a technical report. It is a business communication tool — one that should give any executive a clear picture of SEO’s contribution to the business in under two minutes.
The right dashboard shows the right metrics, tells a clear story, and gives decision-makers what they need to allocate budget, approve strategies, and track progress against business goals. It does not require SEO knowledge to read. It does not require interpretation. It simply answers the question: is this working?
Start simple. Build a first version with three to five metrics, one revenue trend chart, and a plain-language summary of wins and next steps. Improve it each month based on the questions your CEO actually asks. The best executive dashboard is not the most comprehensive one — it is the one that gets read, understood, and acted on.
Struggling to get executive buy-in for your SEO investment? Contact our team and we’ll build you a custom CEO-ready SEO dashboard — one that connects your organic performance directly to revenue, leads, and business growth.