


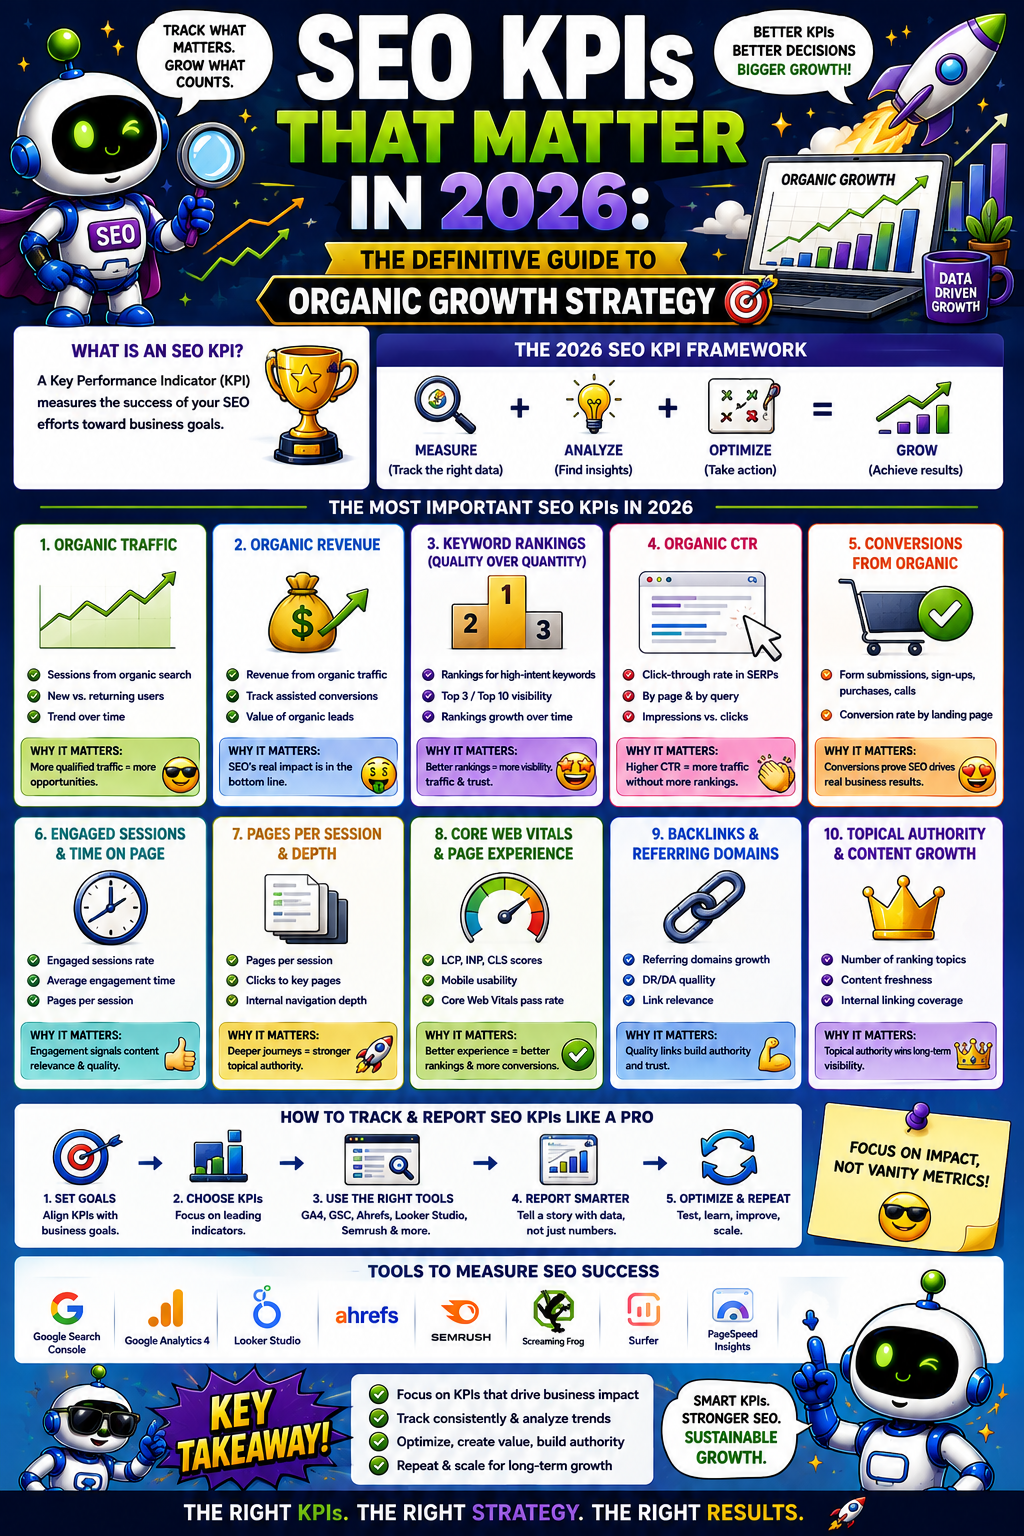
What Are SEO KPIs and Why Must You Redefine Them for 2026?
Direct Answer: SEO Key Performance Indicators (KPIs) are measurable values used by digital marketing teams to evaluate the direct contribution of organic search optimization toward overarching business revenue and user acquisition goals. In 2026, redefining your KPI framework is critical because legacy metrics like raw keyword rankings and total session volume no longer correlate directly with revenue due to AI-generated answers, zero-click searches, and multimodal user journeys.
Legacy search engine optimization relied heavily on top-of-funnel impression hoarding and arbitrary keyword tracking. However, modern Search Engine Result Pages (SERPs) prioritize AI-driven summarization engines, semantic answer engines, and direct entity mapping. As a result, users frequently resolve their informational intent directly on the SERP without clicking through to a domain.
Tracking raw visibility without measuring downstream business impact creates an illusion of success while underlying organic revenue stagnates. To maintain a competitive advantage, enterprise organizations must shift focus toward strategic indicators that measure qualified audience acquisition, engagement intensity, brand entity authority, and pipeline conversion.
Why Are Legacy Vanity Metrics Hurting Your SEO Strategy?
Direct Answer: Vanity metrics like raw traffic volume, keyword rank positions, and total impressions mislead SEO strategies by focusing on surface-level activity rather than qualified business outcomes. These metrics create a false sense of performance because they can increase dramatically without driving a single dollar in pipeline or net-new revenue.
For decades, digital marketing teams presented monthly reports filled with green upward arrows for total session volume and aggregate impression share. In 2026, these metrics represent misleading indicators that divert capital away from high-converting content assets.
Why Do High Keyword Rankings No Longer Guarantee Organic Traffic?
Direct Answer: High keyword rankings no longer guarantee organic traffic because search engines prioritize direct AI overviews, interactive widgets, local packs, and sponsored blocks above traditional blue links. A position-one organic ranking often sits below the screen fold, capturing only a fraction of historical click-through rates.
+————————————————————-+
| SERP TOP OF PAGE |
| [ Sponsored / Ads Section ] |
| [ AI Overview / Generative Answer Engine ] |
| [ Interactive Snippets / People Also Ask ] |
+————————————————————-+
| BELOW THE FOLD |
| 1. Organic Result #1 (Captures ~30-50% less historical CTR) |
+————————————————————-+
The expansion of AI-driven summary panels means that search engines synthesize answers instantly for informational queries. A website can rank in position one for a high-volume keyword but experience a dramatic decline in organic clicks due to zero-click resolutions. Furthermore, personalized search algorithms alter rankings dynamically based on individual user history, geographical location, device type, and real-time contextual intent. Relying solely on static rank trackers yields inaccurate performance data that fails to reflect actual user behavior.
How Does Traffic Volume Fail to Reflect True Business Value?
Direct Answer: Traffic volume fails to reflect business value when incoming search visitors lack buying intent, belong to irrelevant demographic segments, or exit without taking meaningful conversion actions. Broad, high-volume informational traffic frequently inflates server logs while producing zero qualified sales leads or direct ecommerce transactions.
Measuring traffic volume without segmenting by user intent creates severe strategic blind spots. For instance, publishing top-of-funnel informational blog posts can attract hundreds of thousands of low-intent readers who have no inclination to purchase enterprise software or professional services.
This unsegmented traffic consumes infrastructure resources, skews conversion rate optimization (CRO) baselines, and distorts analytics reporting. Enterprise organizations must prioritize the quality and buying readiness of visitors over raw visitor volume.
Why Is Bounce Rate an Outdated Measurement of User Engagement?
Direct Answer: Bounce rate is an outdated metric because modern web architectures, single-page applications (SPAs), and immediate answer formats naturally result in single-page sessions that are highly successful for the user. A visitor can land on a page, find the exact solution to their query in ten seconds, and leave satisfied without triggering a second pageview.
Legacy analytics engines flagged single-page sessions as failures regardless of user satisfaction or on-page interactions. Modern measurement frameworks replace bounce rate with engagement rate, scroll depth tracking, micro-conversion monitoring, and session duration thresholds.
If a user lands on a pricing calculator or a technical documentation page, resolves their inquiry instantly, and exits, the interaction represents a positive user experience. Standard bounce metrics misinterpret these successful interactions as poor performance, leading to misinformed design and content decisions.
Which Revenue-First SEO KPIs Should You Track in 2026?
Direct Answer: Revenue-first SEO KPIs focus exclusively on business impact by measuring Organic Pipeline Value, Customer Acquisition Cost (CAC), Return on Investment (ROI), and Customer Lifetime Value (LTV) generated from organic search channels. These metrics directly connect organic search performance to executive business goals and balance sheet growth.
To secure executive buy-in and justify marketing expenditure, SEO programs must communicate in financial metrics rather than technical search jargon. Evaluating organic performance through revenue-focused metrics aligns search strategies directly with corporate growth objectives.
+———————————————————————–+
| REVENUE-FIRST SEO KPIS |
+———————————————————————–+
| Organic Pipeline Value –> Total qualified pipeline generated |
| Organic CAC –> Total SEO spend ÷ Total new customers |
| Organic ROI –> (Organic Revenue – SEO Spend) ÷ Spend |
| Organic LTV Contribution –> Long-term value of organic customers |
+———————————————————————–+
How Do You Calculate and Optimize Organic Pipeline Value?
Direct Answer: You calculate Organic Pipeline Value by multiplying the total number of marketing-qualified leads (MQLs) generated from organic search by your average opportunity win rate and average deal size. You optimize it by targeting high-commercial-intent search queries and optimizing bottom-of-funnel conversion pathways.
$$\text{Organic Pipeline Value} = \text{Organic MQLs} \times \text{Opportunity Win Rate} \times \text{Average Deal Size}$$
Tracking pipeline value bridges the gap between organic traffic acquisition and sales closure. By integrating search analytics with enterprise CRM platforms such as Salesforce or HubSpot, marketing teams can attribute multi-touch organic sessions directly to active sales deals.
To optimize this KPI, content strategists must map semantic keyword clusters directly to user buying stages, prioritizing bottom-of-funnel terms over low-intent informational queries.
- Audit your existing content database to identify high-converting entry URLs.
- Implement explicit schema markup on transactional landing pages.
- Optimize call-to-action (CTA) elements for high-intent mobile visitors.
- Align keyword targeting with active sales team objection handles.
What Is Organic Customer Acquisition Cost (CAC) and How Do You Reduce It?
Direct Answer: Organic CAC represents the total financial investment required to acquire a paying customer strictly through organic search channels, calculated by dividing total organic spend by net-new acquired customers. You reduce Organic CAC by scaling high-margin evergreen content and improving conversion rate pathways on existing organic traffic.
$$\text{Organic CAC} = \frac{\text{Total Organic Marketing Spend (Agencies + Tools + In-House Content)}}{\text{Total Net-New Customers Acquired via Organic Search}}$$
While organic search is often viewed as “free” traffic, calculating true Organic CAC requires accounting for content production, technical engineering overhead, agency retainers, and enterprise software licenses. A healthy organic search strategy should systematically lower overall customer acquisition costs relative to paid search and programmatic advertising over time.
Reducing Organic CAC involves systematically removing technical friction from high-conversion landing pages, optimizing page rendering speed, and continuously updating existing evergreen assets rather than constantly financing net-new content creation.
How Can You Accurately Measure Organic Search ROI?
Direct Answer: You measure Organic Search ROI by subtracting the total cost of your SEO program from the net revenue generated by organic search, then dividing that figure by the total cost of the program over a specific timeframe. Accurate measurement requires multi-touch attribution models that track organic touchpoints throughout long sales cycles.
$$\text{Organic Search ROI (\%)} = \left( \frac{\text{Net Revenue from Organic Search} – \text{Total SEO Program Costs}}{\text{Total SEO Program Costs}} \right) \times 100$$
Calculating true ROI requires moving beyond single-touch first-click or last-click attribution models, which oversimplify modern multi-device search journeys. An enterprise buyer might discover a brand through an organic informational article, return three weeks later via a branded search query, and convert after clicking a targeted organic comparison page.
Employing multi-touch linear or time-decay attribution models ensures that organic search receives proper credit for middle-of-the-funnel consideration and decision-making touchpoints.
What Role Does Organic Customer Lifetime Value (LTV) Play in SEO Evaluation?
Direct Answer: Organic LTV measures the cumulative net profit a business generates from a customer acquired through organic search over the entirety of their relationship. Tracking Organic LTV helps evaluate whether organic search attracts higher-retention, higher-value customer profiles compared to paid channels.
Customers acquired via organic search frequently exhibit higher retention rates and brand loyalty than those acquired through paid ads, as organic search interactions are driven by active user intent rather than passive ad interruptions.
Evaluating LTV alongside CAC allows organizations to determine the long-term profitability ratio of their organic content investments. A high LTV-to-CAC ratio from organic channels validates larger capital investments in technical infrastructure and authoritative content creation.
How Do You Measure Brand Authority and AI Visibility in 2026?
Direct Answer: Brand authority and AI visibility are measured by tracking your organization’s entity share of voice, presence within AI-generated overviews, branded search volume trends, and citation frequency across trusted knowledge bases. These metrics determine how effectively answer engines and AI search systems recognize and recommend your brand.
Search engines have evolved from keyword indexing algorithms into semantic knowledge graphs. To capture search market share in 2026, brands must ensure their core entities, products, and subject matter experts are deeply integrated into major digital knowledge structures.
+————————————————————————-+
| AI & ENTITY VISIBILITY MATRIX |
+————————————————————————-+
| Brand Entity Mentions –> Structured & Unstructured Web Citations |
| Knowledge Graph Node –> Recognition in Wikidata & Official Sources |
| AI Overview Inclusions –> Frequency of Citation in LLM Summaries |
| Branded Search Share –> Direct Consumer Search Intent Volume |
+————————————————————————-+
What Is Share of Model (SoM) and How Does It Replace Share of Voice?
Direct Answer: Share of Model (SoM) measures the percentage of times a Large Language Model (LLM) or AI answer engine cites or recommends your brand when answering relevant industry queries compared to your direct competitors. It replaces traditional Share of Voice by focusing on AI-generated recommendations rather than standard link lists.
As consumer search behavior shifts toward conversational AI interfaces, tracking traditional impression share across web pages is no longer sufficient. Share of Model quantifies how frequently your brand appears within synthetic text summaries generated by platforms like ChatGPT, Google Gemini, Perplexity, and Claude.
[ User Prompt ]
|
v
[ AI Model Processing / Vector Search ]
|
+—————————+—————————+
| |
v v
[ Brand A Cited (40%) ] [ Brand B Cited (20%) ]
(High Share of Model) (Low Share of Model)
Monitoring SoM requires running standardized prompt matrices across target commercial categories to evaluate recommendation frequency, sentiment polarity, and source link attribution.
- Establish a monthly benchmark of key industry prompt queries.
- Query major LLM APIs systematically to capture brand mention outputs.
- Calculate brand inclusion percentages against core market competitors.
- Analyze underlying source citations to target PR and backlink efforts.
How Do You Track Entity Citations Across AI Knowledge Bases?
Direct Answer: You track entity citations by monitoring structured databases like Wikidata, industry-specific knowledge graphs, and authoritative third-party publications using digital brand monitoring platforms and vector index tools. Tracking these citations ensures search engines correctly associate your brand with relevant technical concepts.
Search engines validate brand authority through entity-attribute-value triples established across the web. If an organization lacks representation across recognized knowledge databases, semantic algorithms are less likely to surface its content for competitive non-branded queries.
Monitoring unlinked brand mentions, structured organizational schemas, expert author profiles, and co-occurrences with industry terminology allows SEO analysts to evaluate and strengthen their overall entity footprint.
Why Is Branded Search Volume the Ultimate Test of Brand Health?
Direct Answer: Branded search volume measures the total quantity of searches performed specifically for your company name, proprietary products, or key personnel. It represents the ultimate test of brand health because it reflects genuine off-page demand, consumer trust, and direct awareness generated across all marketing channels.
Search algorithms treat sustained increases in branded search volume as a primary quality signal. High branded query volume signals to algorithms that users specifically seek out your business above generic category alternatives.
When branded search volume rises, domain-level click-through rates, trust scores, and non-branded ranking stability improve. Tracking month-over-month growth in branded queries serves as a reliable lead indicator for overall organic performance.
What Search Experience and Conversion Metrics Define Modern Success?
Direct Answer: Modern search experience and conversion metrics measure user behavior after the click, focusing on engagement rate, journey completion, micro-conversions, and organic conversion rate. These metrics evaluate how effectively your landing pages satisfy search intent and guide visitors toward business actions.
Attracting visitors to a website is only the first half of the organic growth equation. Once a user lands on a page, site architecture, page performance, content layout, and clear conversion pathways determine whether that visit converts into tangible enterprise value.
| Search Metric | Primary Focus | Key Business Value |
| Engagement Rate | Active session duration & interaction | Validates content quality and initial intent match |
| Micro-Conversions | Intermediate steps (downloads, video plays) | Maps progress through complex buyer journeys |
| Organic Conversion Rate (OCR) | Final goal completions (purchases, leads) | Measures direct commercial efficiency of search traffic |
| User Journey Completion | Multi-page logical task flows | Indicates optimal site structure and UX efficiency |
How Do You Optimize Organic Conversion Rate (OCR) for High-Intent Traffic?
Direct Answer: You optimize Organic Conversion Rate (OCR) by removing usability friction on key landing pages, contextualizing calls-to-action to match specific query intent, improving layout visual hierarchy, and ensuring fast page load speeds. Higher OCR extracts more revenue from existing organic traffic without requiring additional visitor volume.
$$\text{Organic Conversion Rate (\%)} = \left( \frac{\text{Total Organic Goal Completions}}{\text{Total Organic Sessions}} \right) \times 100$$
Optimizing OCR requires segmenting traffic based on search intent categories. Users arriving from informational search queries should be guided toward educational micro-conversions, such as downloading a whitepaper or subscribing to a newsletter.
Conversely, traffic landing on high-intent commercial landing pages should encounter immediate, frictionless transactional conversion options, such as booking a product demonstration or initiating a free trial. Aligning conversion pathways with specific user intent maximizes revenue generation across all traffic segments.
What Are Micro-Conversions and Why Are They Essential for B2B SEO?
Direct Answer: Micro-conversions are incremental engagement steps—such as downloading a technical datasheet, using an interactive calculator, playing a product demo video, or signing up for a webinar—that signal user interest before a final sale. They are essential for B2B SEO because enterprise sales cycles are long and involve multiple decision-makers.
In complex B2B industries, prospective buyers rarely make immediate purchasing decisions during an initial organic search visit. Expecting immediate bottom-of-funnel conversions from top-of-funnel informational traffic leads to inaccurate performance evaluations.
By tracking micro-conversions, SEO strategists can evaluate how effectively informational assets move prospects forward through the consideration phase, providing valuable data to refine mid-funnel content pathways.
How Does User Journey Completion Signal Satisfied Search Intent?
Direct Answer: User journey completion tracks whether a search visitor successfully navigates a logical sequence of pages to resolve their underlying problem without returning to the SERP to click a competing result. High journey completion signals to search algorithms that your content fully satisfied the user query.
When a user performs a search, clicks a result, and subsequently completes an intended task—such as reading an in-depth article, viewing a comparison matrix, and submitting an inquiry—they demonstrate that their search intent was satisfied.
Conversely, if a user immediately returns to the search results page to click another link (pogo-sticking), algorithms interpret this behavior as a failure to satisfy search intent. Structuring logical internal linking pathways and providing comprehensive contextual content keeps users engaged on-site and prevents query bounce.
What Technical Performance KPIs Guarantee Site Health and Indexation?
Direct Answer: Technical performance KPIs—including Real User Core Web Vitals, Crawl Efficiency Ratio, Indexation Accuracy, and Rendering Error Rates—ensure search engines can efficiently crawl, render, and index your content while delivering a fast, responsive user experience.
Technical SEO provides the operational foundation for modern organic performance. Even the highest-quality, most authoritative content fails to perform if search engine bots encounter technical access barriers, slow rendering execution, or index bloat.
+————————————————————————–+
| TECHNICAL PERFORMANCE KPIS |
+————————————————————————–+
| Core Web Vitals –> LCP, INP, and CLS performance scores |
| Crawl Efficiency Ratio –> Useful page crawls vs. Wasted crawl budget |
| Indexation Accuracy –> Index status of intent-driven pages |
| Rendering Health –> JavaScript execution success and speed |
+————————————————————————–+
Which Core Web Vitals Matter Most in 2026?
Direct Answer: Interaction to Next Paint (INP), Largest Contentful Paint (LCP), and Cumulative Layout Shift (CLS) are the three critical Core Web Vitals in 2026. INP is particularly crucial because it measures full page responsiveness during user interactions, directly influencing user satisfaction and mobile performance signals.
Search engines prioritize user experience metrics as core ranking inputs. While LCP measures perceived visual loading speed and CLS measures visual stability during rendering, INP evaluates the overall interactive responsiveness of a page throughout its entire lifecycle.
- Largest Contentful Paint (LCP): Target $\le 2.5\text{ seconds}$ to ensure main content renders rapidly.
- Interaction to Next Paint (INP): Target $\le 200\text{ milliseconds}$ to eliminate input response delay.
- Cumulative Layout Shift (CLS): Target score $\le 0.1$ to prevent unexpected visual layout shifts.
Optimizing these metrics requires streamlining main-thread JavaScript execution, leveraging modern image formats, implementing efficient server-side caching strategies, and utilizing modern content delivery networks (CDNs).
How Do You Measure Crawl Efficiency and Indexation Health?
Direct Answer: You measure Crawl Efficiency by analyzing server logs to calculate the ratio of valuable, content-rich pages crawled by search engine bots against low-value or duplicate URLs. Indexation Health is measured by comparing the number of intentionally submitted sitemap URLs against the actual URLs retained in the search engine index.
$$\text{Crawl Efficiency Ratio (\%)} = \left( \frac{\text{Unique Valuable URLs Crawled}}{\text{Total Bot Requests Received}} \right) \times 100$$
Large enterprise websites frequently waste significant crawl budget on thin parameter URLs, faceted navigation filters, duplicate session IDs, and unoptimized redirect chains.
Analyzing log files regularly allows technical teams to identify bot crawl patterns, block inefficient crawling paths using robots.txt directives, enforce clean canonicalization rules, and ensure search engine crawlers spend resources exclusively on high-value, revenue-generating pages.
How Do You Build a 2026 SEO Dashboard Focused on Executive KPIs?
Direct Answer: You build a 2026 executive SEO dashboard by consolidating high-level business impact metrics—such as Organic Pipeline Value, Customer Acquisition Cost, Organic ROI, and Share of Model—into a single visual dashboard while filtering out granular operational tactics.
Executive stakeholders require clear, concise reporting that connects marketing investments directly to financial growth. Dashboards filled with micro-level technical details distract from strategic business contributions and complicate resource allocation discussions.
+———————————————————————–+
| EXECUTIVE DASHBOARD LAYOUT |
+———————————————————————–+
| [ Top Row ] Organic Revenue | Organic CAC | Organic Pipeline |
| [ Middle Row ] Share of Model | Organic OCR | Branded Search Vol |
| [ Bottom Row ] Top Revenue URLs | Core Web Vitals Health Status |
+———————————————————————–+
What Operational Metrics Should You Omit from Executive Reports?
Direct Answer: You should omit operational metrics such as individual keyword rank movements, total raw impressions, page-level backlink counts, meta description coverage, and site-wide bounce rates from executive reports. These data points represent internal execution metrics rather than business performance indicators.
While operational metrics remain useful for day-to-day tactical execution by SEO managers and specialists, presenting them to executive leadership dilutes the strategic impact of your reporting.
Senior leadership focuses on business growth, market share expansion, unit economics, and pipeline generation. Keep tactical diagnostics in internal execution dashboards and restrict executive reporting to revenue and authority metrics.
How Do You Structure a Tiered SEO KPI Reporting Architecture?
Direct Answer: You structure a tiered reporting architecture by establishing three distinct reporting levels: Executive (focused on revenue, ROI, and Share of Model), Strategic (focused on conversion rates, category visibility, and cluster performance), and Tactical (focused on technical site health, backlink acquisition, and page rankings).
+———————————–+
| EXECUTIVE LEVEL |
| – Revenue, Pipeline, CAC, ROI |
+———————————–+
|
v
+———————————–+
| STRATEGIC LEVEL |
| – Category OCR, Share of Model |
+———————————–+
|
v
+———————————–+
| TACTICAL LEVEL |
| – Ranks, Indexing, Log Analysis |
+———————————–+
A tiered structure ensures that every stakeholder within an organization receives clear, actionable data customized to their specific role:
- Executive Tier (C-Suite, VP): Tracks macro-financial contribution including Organic Revenue, Organic Pipeline Value, Organic CAC, Organic ROI, and Share of Model.
- Strategic Tier (Directors, Lead Strategists): Tracks operational performance trends across business categories, cluster-level organic traffic conversion rates, branded search growth, and overall site health metrics.
- Tactical Tier (SEO Specialists, Content Writers, Developers): Tracks technical execution details including individual keyword rank movements, page-level log file issues, Core Web Vitals diagnostics, indexation errors, and link acquisition logs.
Implementing this tiered architecture aligns day-to-day tactical execution directly with broader corporate growth initiatives, ensuring full visibility and strategic focus across all organizational levels.